Are you looking for a way to display data on your site in a more interesting way?
Then you might want to check out a data visualization plugin. Data visualization plugins help you present your data in the form of pie charts, graphs, pictograms, colorful charts or even infographics.
While there are hundreds of options available on the market, it’s not possible to test each of them to pick the right one for your website.
That’s why we’ve put together a list of the best data visualization plugins which includes both premium and free options.
Benefits of Visual Representation of Data
Presenting your data in a visual form can have several benefits. Here are some of them.
- Users can grasp information faster without going into too much detail.
- It simplifies complex data for easy comprehensions as compared to cluttered spreadsheets and reports.
- It’s easier to portray emerging trend and its change over time.
1. WPForms
WPForms is a form builder plugin that lets you create any kind of form for your website within a matter of minutes. You can use its Surveys and Polls addon to create surveys and polls and display the results in real-time.
Once a user submits a survey, you can offer beautiful reports with the best visualization options. This can be in the form of a pie chart, bar graphs, line charts (which can either be vertical or horizontal) and more.
It also offers several amazing form templates to help you make a quick start.
Learn more about WPForms here.
2. MonsterInsights
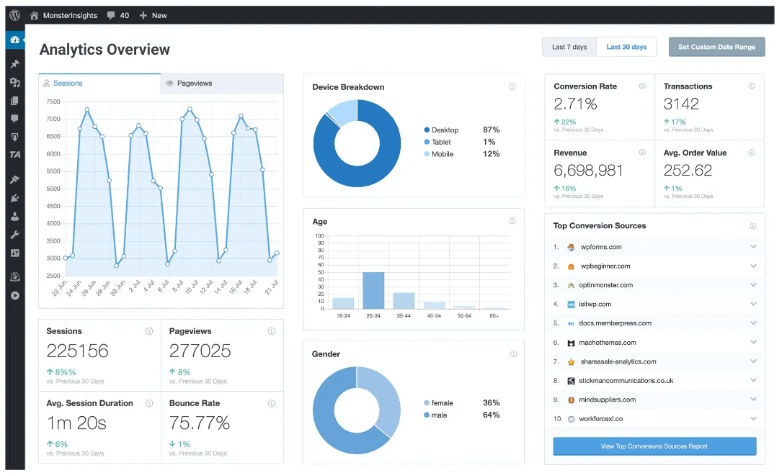
MonsterInsights is the best Google Analytics plugin for WordPress. It helps you get visualized data reports on your website.
If you’re managing websites for clients, you can get beautiful reports on every website you manage. There are tons of add-ons to get data on forms, eCommerce, custom dimensions, and more.
You can export PDF reports that you can share with clients, team members, and anyone else you need.
3. Formidable Forms
Formidable Forms is another great form builder plugin that lets you create any kind of forms with just a few clicks. You can also use it to display your data in the form of charts, graphs, statistics, etc. from your form entries.
The best part is that you can either use the data you collect or import to create beautiful graphs and charts.
The plugin also offers various customizable layout designs and form templates. Each form can be customized to meet your requirements by adding color, padding, borders and more. You can also import or export a form that you’ve created to or from your website without any complications.
Here’s more about Formidable Forms.
4. WP DataTables
WP DataTables is one of the best plugins for creating tables and charts. Once the table is created, you can easily customize it from the front-end or back-end, whichever is easier for you.
If you want, you can let your users edit the data they have entered. It even offers advanced options like conditional formatting, advanced filtering, calculating totals for columns, etc. You can use creation wizards like HighCharts, Chart.js or Google Charts to create dynamic charts and it allows grouping of similar rows together.
5. Data Tables Generator
Data Tables Generator lets you create responsive and fully customizable table and charts without any coding. This plugin works best with WooCommerce.
The plugin fully supports product attributes and categories too. You can also add columns to the table displaying the summary of your products, date of expiry, price, reviews and more.
That’s it! We hope you found our list on the best WordPress plugins for data visualization helpful. If you liked it, you might also want to check out the best table plugins for your WordPress site.





Comments Leave a Reply